I hope you are well, and are enjoying this very moderate weather as we approach another holiday season (the season of giving).
DID YOU KNOW THAT: Saskatoon Residents Donate on average $410 dollars per person a year! That's $130 more than the Canadian average, and $30 more than Saskatchewan's Average! Way to go SSKTN!
Brodie’s Real Estate Report (October 2015)
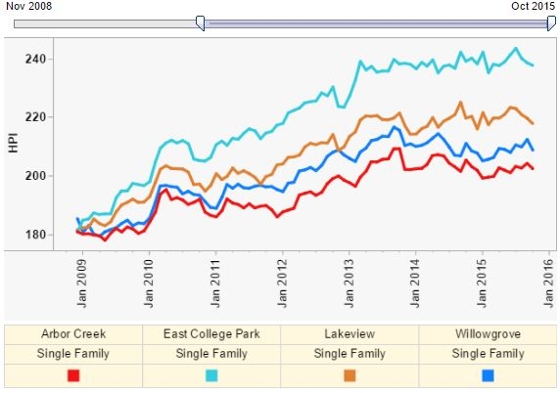
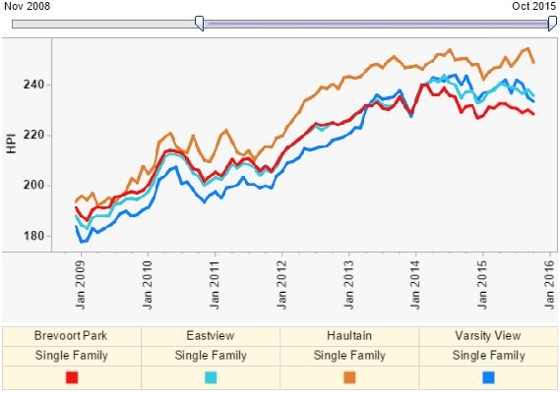
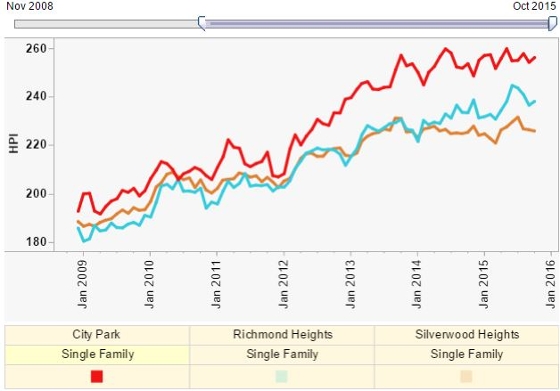
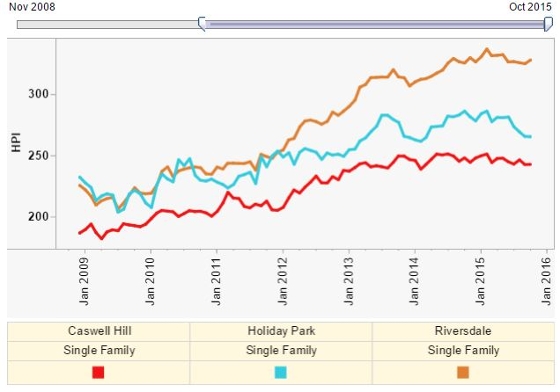
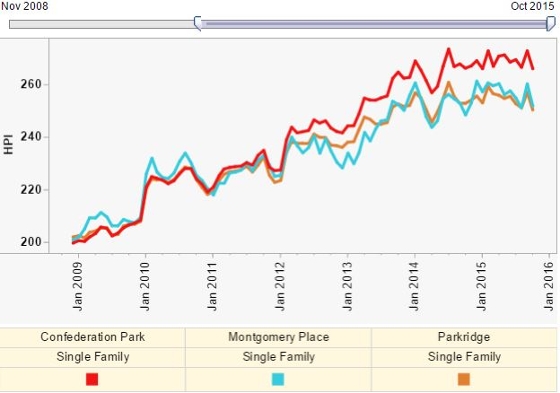
This month, I wanted to focus on housing price inflation within different areas of the city of Saskatoon (Using the MLS Housing Price Index)! The question I wanted to answer was this: Were certain neighborhoods within their respective areas, appreciating more than others over the last 7 years?
AREA 1 : Arbor Creek vs. East College Park vs. Lakeview vs. Willowgrove
WINNER: East College Park
AREA 2: Brevoort Park vs. Eastview vs. Haultain vs. Varsity View
WINNER: HAULTAIN
Area 3: City Park vs. Richmond Heights vs. Silverwood Heights
WINNER: CITY PARK
AREA 4: Caswell Hill vs. Holiday Parl vs. Riversdale
WINNER: Riversdale
AREA 5: Confederation Park vs. Montgomery Place vs. Parkridge
WINNER: CONFEDERATION PARK
I have some very EXCITING market analyse below. Questions I will answer: What are current housing inventories and months of supply? How were sales in October 2105 vs. previous years?
Read along for all these answers.... it's pretty good stuff!
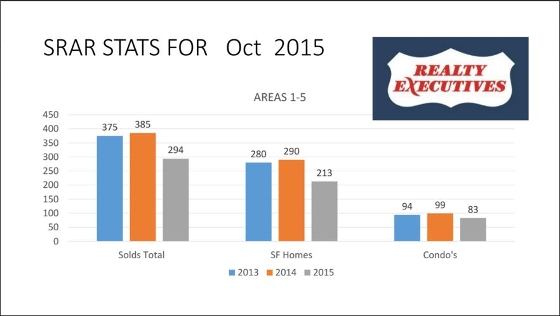
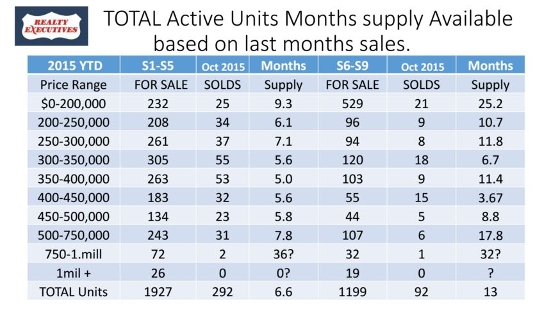
There were a total of 294 sales in Saskatoon last month, which was 25% lower than last October. 213 of those sales were single family homes and 83 of those were condominiums. Currently, there are 1238 single family homes and 711 condos on the Saskatoon real estate market for Sale. Listings are up about 8% vs. last year.
The below graph shows the number of sales in Saskatoon (Areas 1-5 represent within city limits). Historically, federal elections months tend to have below average sales. October 2015 supported that trend, as 91 fewer homes sold in October 2015 vs. October 2014.
Which price ranges have the highest months of supply?? Typically anything between 4-8 months of supply is considered a balanced market. Anything lower is a seller's market; higher, a buyers market.
Sales to Listing Ratio
(<40% = buyers market, 40-60% = balanced market, >60% = sellers market)
Sales to listing Ratio for Areas 1-5 for October 2015 = 38%
38% of homes listed on the MLS in October actually SOLD.
Sales to Listing Ratio for Areas 6-9 for October 2015 = 41%
If you or anyone you know has any questions regarding this information please call or email! I would be happy to give the HIGHEST LEVEL of Professional service if you or someone you know is buying or selling their house! I love referrals!
I am always available to answer any questions or concerns regarding Real Estate in Saskatchewan! Remember I do Farm and Commercial real estate too!
Like me on facebook, I try and always keep my audience involved or stay up to date on my website at www.saskatchewanliving.com .
"Freedom is never given, it is won."
- A. Philip Randolph

e. brodiezuk@realtyexecutives.com
Comments:
Post Your Comment: